By Maria Martinez de Ubago on 13/11/2018
Topics: Sustainable Energy Management
Register for our webinar on EU-ETS at https://www.eecc.eu/webinar-european-emission-allowances
Until last summer, only a few consumers were interested in the evolution of the EU ETS market. However, the correlation observed in recent months between high electricity prices and the steep increase in coal prices has sparked consumer interest in this "mysterious" market. In the following blog article, we’ll give you an introduction into the emission rights market: how does the mechanism work, is it a liberalized market, who participates and finally, what’s causing the current sharp increases?
It might surprise you, but the United States was the first country to investigate how to reduce emissions. In the seventies, micro-economic computer simulations helped the US EPA (United States Environmental Protection Agency) to compare the effectiveness of different control strategies and determined the cost (being the impact on the environment) of emissions from different sources (industry, transportation, power production, …). These findings gave birth to the idea of cap-and-trade, later incorporated into the Kyoto Protocol.
Cap-and-trade is a system where the government decides on an acceptable total for emissions of various pollutants with emphasis on greenhouse gases. The total is divided into credits, or emission rights, which are sold by governments to polluting companies (manufacturers etc.). Companies that generated less emissions can sell their credits to companies that generated more emission.
In Europe the system is called EU ETS. Companies that are compliant to the system (among other companies with combustion installations with a rated thermal input exceeding 20 MW) need to submit their emission report each year and the data must be verified by an accredited verifier by March 31st of the following year. Once verified, the equivalent number of allowances must be hand in to the country-specific institution (such as Departement Omgeving (LNE) in the Flemish part of Belgium) by April 30th of that year.
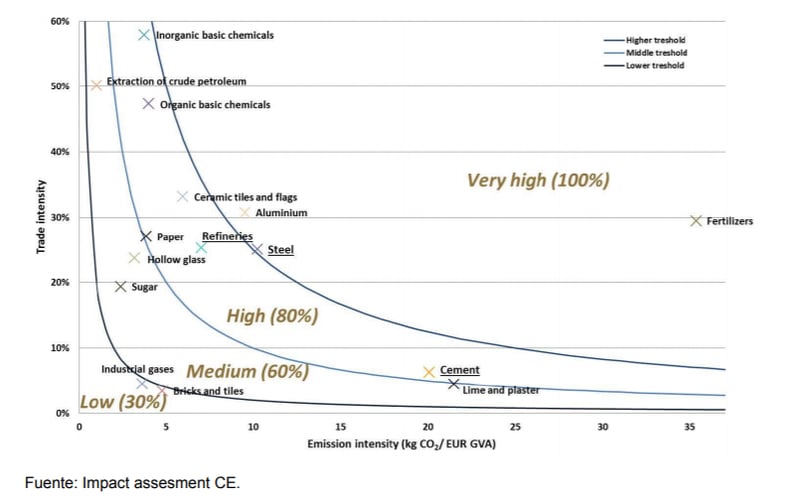
One right is equal to one ton of CO2 and there’s a maximum of rights offered, hence the “cap”. These rights are not only sold by auction, but some companies are allocated rights for free to avoid carbon leakage. This concerns industrial sectors that are not able to pass on the cost of these rights to their end-consumer as it would damage their competitiveness. The sectors and sub-sectors deemed to be exposed to a risk of carbon leakage are defined in an official list.
They receive 100% of the rights they need to cover their emissions for free. Companies in other sectors also receive allocations for free, but not that all of them. In 2013 for example, their allocation was multiplied by 80% and the percentage decreases gradually in time to 30% in 2020. The remaining volume must be bought by the participants and should incentivize them to reduce their emissions by investing in clean technology.
The electricity sector was excluded from this system of free allocations as they do not compete in international markets and are able to transfer these costs to their end-consumers. However, this results in higher prices and in the end still affects many sectors as they need this more expensive electricity to manufacture their products. To cover the risk of these companies relocating to other countries where regulation is less strict, member states are allowed to grant state aid.
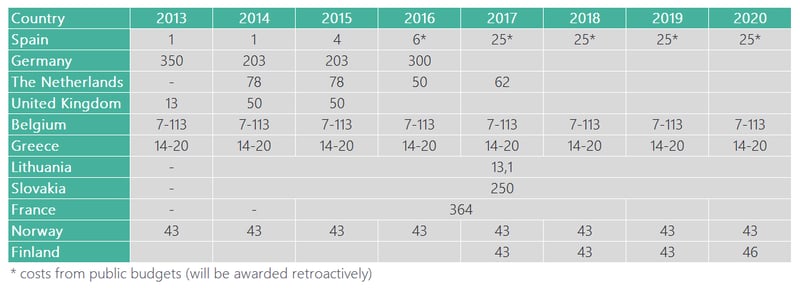
State aid granted by European countries, within the trading scheme of emission rights to offset indirect costs (in millions of Euros, millions of pounds for the United Kingdom). Source: Directorate-General for Competition
Revenues generated from the EU ETS provide financial support for innovative renewable energy technology and carbon capture and storage projects through the NER300 fund and it also provides Member States with funding that can be used for low carbon and renewable energy programs. However, the main goal is to incentivize companies to invest in cleaner technologies. This means the price should be high enough but if it’s too high, there’s the risk that the European industry loses competitiveness and relocates which results in less economic activity and jobs. Hence, there always needs to be a balance of supply and demand which implies the trading market cannot be free and requires intervention.
The emission trading mechanism went through three phases, 2005-2007, 2008-2012 and 2013-2020, and in the meantime various adjustments were needed to adapt the model to the market reality and to keep it efficient. The problem is that since its introduction, there has always been an excess of supply which lowers the incentive.
The goal of the third phase (2013-2020) was to reduce European emissions by 20% in 2020 compared to the year 1990 but as the phase already started with an excess of supply, prices were very low. The European Parliament tried to intervene by adopting a series of measures to balance the market. The first measure was a backloading mechanism delaying the auction of 900 million EUAS from the first years to 2019 and 2020 instead. However, the measure was not successful, and prices did not increase as expected.
During the 2015 United Nations Climate Change Conference in Paris, the members decided to maintain the agreements in Kyoto but did point out that some adjustments were necessary. The reduction target was increased to 40% less emissions by 2030 and the possibility of transferring rights between countries would also be discussed.
The introduction of the Market Stability Reserve
The first document formalized by the European Union to reform the emission market was published at the end of 2017. The introduction of the Market Stability Reserve as of 2019 should be a long-term solution to bring and keep prices at a higher level by eliminating the excess supply. Consequently, the price of certificates skyrocketed as you can see on the graph below.
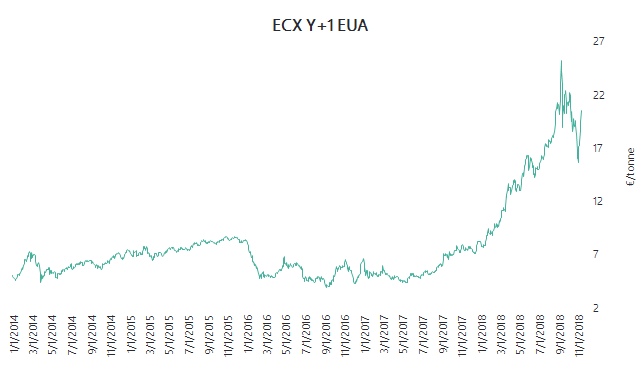
Source E&C daily market analysis
A few months later, the European Council also approved a reform of the EU ETS for the period after 2020. The supply of carbon permits will be limited by:
This made prices triple in recent months. A possible end of the excess of rights stimulated demand and market participants and speculators began to buy emission rights more actively. According to the High-Level Commission on Carbon Prices the carbon-price level should be at least USD40–80/tCO2 by 2020 and USD50–100/tCO2 by 2030 to achieve the Paris temperature target. Will prices ever reach this level and what will the impact?

According to the most recent publication on the total number of allowances in circulation in 2017 (published May 15th, 2018) the oversupply was at more than 1,6 billion – nearly 16% of the total supply. At first sight, it doesn’t seem like the measures stipulated above will cover this excess.
In theory, whether these excess emission rights are allocated for free (42% was allocated for free in 2017) or auctioned, shouldn’t have an impact on the price. If you organize an auction and there is a larger supply than demand, the prices in that auction should be very low.
In practice however, the fact that the total quantities are reduced combined with the fact that less emission rights are available free of charge creates a perception of scarcity, and it is this perception that has caused prices to increase. You also need to take into account that a lot of the participants in this market are reluctant to trade. There are a few participants, such as the energy companies, that possess large portfolios of emission rights that they have traded actively ever since 2005. On the other hand, there is a large mass of companies, mainly manufacturing industries that have small allocations of a few ten thousand of rights. They have always considered ETS primarily as a compliance issue. This means that their main pre-occupation is to have enough emission rights when the moment of handing in comes. This means that they are hoarding excess emission rights, keeping them for a rainy day when they might have a shortfall in allocations. The reduction of free allocations and increase in auctions is stimulating this hoarding behaviour.
ETS is a market where the active traders are short and those who are long are holding on to their positions, which explains the bullishness. From time to time the excess emission rights find their way to the market, which explains the sudden sharp drops like we’ve seen in the last weeks.
Written by Maria Martinez de Ubago and Vera Ruffato