By Matthias Snoeck on 28/07/2020
Topics: LNG, Energy Markets
The commissioning of the first LNG train in the Sabine Pass back in 2016 created a lot of buzz in the worldwide natural gas market. In combination with the US shale gas boom, the new LNG exports marked the beginning of a vast moving supply transition. For many large LNG buyers in the market, the US cargoes were a cheap and flexible alternative gas source. Fast forward a couple of years and you clearly see the impact of US LNG on the worldwide supply situation. US fuel has set the price standard in both the Asian and European gas markets. Along with the classic supply sources, it helped to flood the European market resulting in an oversupply situation.
The ample supply situation pushed both spot and forward gas prices to historically low rates. From a buyers perspective in 2019, this spurred a lot of opportunistic moments to secure low gas budgets for the next three years or longer. This year, the COVID-19 pandemic eroded demand and further aided the bearish price trend. Now, over the past few weeks there have been LNG cancellations coming into Europe. Every day a new article is published by Reuters or Montel hinting at US LNG shut-ins with negative price outlooks for the front month period. But what does this mean?
In this blog article we dive into the current LNG market situation to ascertain the reality of the situation. We look at various data to better understand the different dynamics and analyse what we can expect in the coming months. We will not, however, make any forecasts on what future prices will be.
Due to a lack of own resources or an ever-declining local production (like, for example, in the Groningen gas field) the major European gas consuming countries have always relied on gas import: a combination of pipeline capacity and flexible LNG cargoes.
Last year, European gas imports reached a historic high, especially with regard to the pipeline supply from Norway and Russia. This was despite the occasional supply disruptions due to prolonged Norwegian maintenance or lingering transit fee disputes between Russia and Ukraine, and with Nord Stream 2 still not finished.
Looking at the graph below, you can see that gas imports peaked at the end of last year. The big increase in gas import is mainly linked to LNG sendouts, i.e. natural gas injected into the transportation infrastructure after odourization. A first increase occurred in October 2018 and it continued until the end of 2019. In the first half of 2020 there is a clear drop in overall imports, especially with the Russian pipeline flows. This is not the case for LNG imports (sendouts), however, as the daily volumes remained close to the levels we saw at the end of 2019.
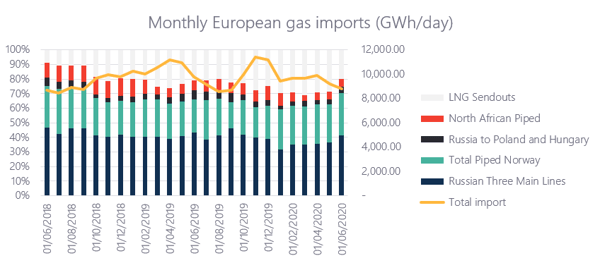
The general drop can be partially explained by the very high gas storage levels and a declining demand due to a slowdown of economic activity following COVID-19.
European LNG imports increased from January until March. The month of June is the first one to really buck the trend with a 32% drop. The total volume in bcm is even lower than the same month last year (8,66 bcm in June 2020 compared to 9,35 bcm in June 2019).
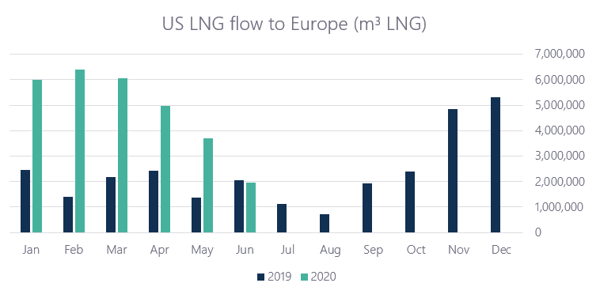
When looking at US LNG imports into Europe, it’s baffling at first to see US flows booming from January to March in times where Europe started the year with gas storage filled to roughly 90% of the maximum capacity, and with no major issues in terms of classic import. In the first six months, a total of 29 million cubic meters of LNG was imported from the US. This is a remarkable figure seeing that in the same period last year the total was only 11,9 million cubic meters.
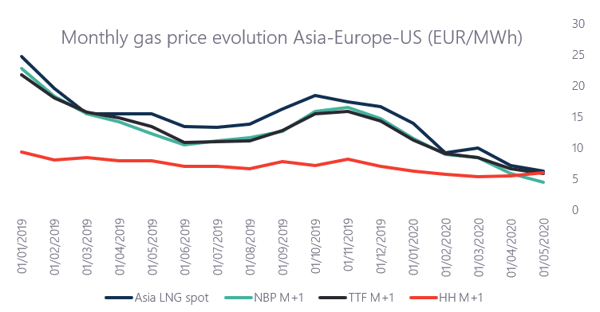
Nevertheless, from an economic point of view, it made perfect sense to ship US LNG towards the European gas market during the first 3 months of the year. As you can see from the graph above, the spread between the major European gas hubs and the American Henry Hub remained optimal even though the general trend was bearish. The situation changed in the second quarter, when European gas spot prices repeatedly hit values below its American counterpart but still the US kept exporting. At the end of April, first the British NBP traded below the US Henry Hub, then the Dutch TTF equivalent followed suit mid-May.
The recent COVID-19 crisis and a negative economic outlook drastically lowered demand for large industrial consumers. European players like Royal Dutch Shell, Enel and Uniper have all cancelled LNG cargoes in recent weeks. For the month of June alone, roughly 20 cargoes were cancelled and for the month of July the estimation is set at around 40 to 50 vessels. Over the past weeks practically no vessels were bound for the UK gas market. A drastic change to the 5 or more vessels per week that had commonly arrived and discharged their LNG volume. So, as you are reading this blog article shut-ins are occurring in the US LNG market and more cancellations can be expected if the overall supply situation in Europe remains as it is. The latter might also be an indication that investors in new LNG terminals made the wrong bet. To better understand the current flow situation, we´ll dive a little deeper into the way pricing is done in the LNG market.
Normally US LNG producers, like Cheniere Energy Inc., buy feedstock gas for its LNG facilities and sell this gas to a long-term buyer at 115% of the Henry Hub price (a 15% margin to cover conversion losses during the production process) plus a liquefaction fee of around 2 to 3,50 US Dollars/MMBtu. This type of price formula protects producers from any fluctuations in the US gas price and covers the costs of transforming the gas into a liquid form. Due to the volumetric flexibility, the gas competes with spot prices around the world. The buyer agrees to pay the liquefaction fee regardless of whether he or she lifts the contracted LNG volume or not, making it most likely that this fee will be treated as a sunk cost on the buyers’ side. In other words, it will not materially influence the decision to export the gas towards the destination market. The importer thus only needs to consider the variable costs linked to the operation, so everything related to shipping or freight rates, regasification and pipeline transportation capacity. As the counterparts in such long-term contracts are typically large energy suppliers, they already own such installations or have long-term contracts that grant them access.
Assuming the sunk cost of liquefaction, it is possible to simulate the ´potential margin´ of a US LNG buyer. In the graph below you can find a comparison between the average TTF month price and Henry Hub including an increase of 15%[1] and a cost for shipping and regasification set at a fixed rate of 0,45 US Dollars/MMbtu to 0,30 US Dollars/MMbtu[2]. The cost for liquefaction is excluded from the equation.
[1] Based on settlement values of June 30, 2020. From August on, the month product on the respective forward market is used.
[2] In reality, these costs will differ per month based on the specific destination country and reference market (spot vs forward).
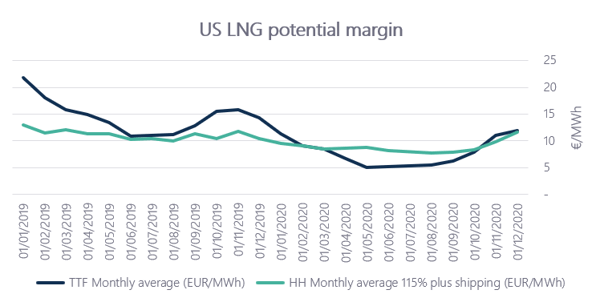
In January 2019, the spread was at its highest with a difference of almost 9 Euros/MWh. In Q4 2019 there was a new window of opportunity as the spread was around 4,50 Euros/MWh. The latter period being the same during which LNG import volumes in Europe peaked to a historic high. The spread converged again in February-March, which would justify the peak in LNG flow during these months (see the US LNG flow chart). As of April 2020, however, the margin becomes negative. The difference of minus 2 to 4 Euros/MWh made a shut-in procedure more suitable and logical, and indeed we have seen signs of this with cancelled shipments in June. As shown in the US LNG flow chart, general LNG imports were brought down to similar figures in June compared to the year before.
Based on the reasoning in the above described paragraph, LNG exports will occur if the price in the targeted destination market is higher than the delivery cost of US gas, excluding any sunk costs, although exports will remain even if the price difference is not interesting. The buyer of course will still have to honour the take-or-pay clause/fee in the contract. Actual flow figures also indicate that a positive price difference in the reference European gas index compared to the US Henry Hub is not always required to ship volumes. If a buyer owns various parts of the value chain, the price difference can be very low and to some extent even negative. Executives of Cheniere told the media back in 2017, at the moment of a new terminal inauguration, that in some cases they would ship volumes out even if the price difference is negative. As long as the variable costs of exporting covers the shipping and other costs, exports will occur as they help reduce the firm’s losses it would otherwise incur by exporting on a full-cost basis (fixed and variable costs combined).
However, importing US LNG to Europe continues even when the market price is low or when the price difference is negative. The explanation for this is simple: it’s not very practical to constantly shut down and re-open liquefaction trains based on rapid price movements in the market. On top of that, US LNG has a key advantage in the form of destination flexibility, meaning there is the freedom to deliver at different terminals. This creates a less take-or-pay risk for the buyer with the volume commitment as it can be sold in different markets.
When the spread is low or negative, shut-ins can occur and, in a market where global prices remain low for a long time this can endure, thus resulting in numerous cancellations. It is simply a way for the industry to deal with a supply glut. In 2017, BP Commercial Executive Jimmy Straughan himself expressed that shut-ins from time to time would help to balance the market. When he expressed this, he also made the prediction that the market would be somewhat balanced mid-2020. However, as the market evolves very quickly, the slightest price difference can spark renewed exporting interest. Europe has always been a favourable trading market as it has historically had enough storage capacity, often making it the market of last resort. Balancing the market is surely worth some shut-ins, but even if more shut-ins occur, the situation can rapidly change.
Exporters also tend to look for alternative ways for pricing LNG. In June of last year for example, Cheniere reached a deal for its Corpus Christi train 3 with Apache Corp’s Permian asset to buy natural gas linked to the LNG it ends up selling.
The shift away from the classical approach towards netback pricing is much more flexible in terms of selling and helps attract buyers in a fast-growing global market. Netback[3] can be defined as the revenues from the sale of all products generated from bringing one unit to the marketplace minus the summary of costs associated with that same unit. According to Eikland Energy, the implications of this change are rather substantial and can play out quite dramatically over time. It could, for example, result in unfair competition over time. Also, it can be quite confusing as most low prices still reflect the Henry Hub +15% premium methodology.
[3] Netbacks are calculated by subtracting the cost of production, transportation, marketing and other costs to bring oil or gas to the market from the revenue. In the oil market it is commonly calculated as a per barrel of oil equivalent.
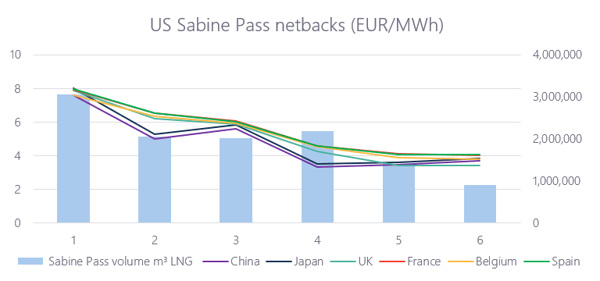
However, when looking at the netbacks we can better understand the logic behind the vast LNG flows from the US to Europe in the first few months of 2020. In the graph below, the average netback in US Dollars/MMBtu is shown in combination with the LNG flows from the Sabine Pass[4]. Based on this information we can conclude that the European countries were in general a better destination for the same volume of natural gas compared to the Asian market, i.e. Japan and China, but the main thing is that delivering to all of these regions is still profitable.
[4] Data based on periodic information found on Reuters
Oversupply in Europe has been an issue for years and will no doubt continue. The current economic situation has simply exacerbated the situation. The low demand this caused as well as storage at capacity triggered a drop in cargoes importing to Europe. Full utilization of US export capacity is unlikely based on the way LNG is priced. Narrow margins will often open and close the window of opportunity to export US LNG towards Europe.
It is important to stress however that US LNG imports are still coming as importers try to balance supply. Regardless of the sunk costs, it remains profitable for the US to export their LNG based on netback pricing. At the moment shut-ins occur based on purely economic grounds, but they will not become a problem as the logistics are even worse than settling with small losses. However, if such a situation endures, switching toward netbacked value pricing makes more sense.
Let’s see how the situation unfolds over the next few months.
Want to keep up to date on the market situation as it unfolds? Subscribe to our market updates here and get three months for free.