By Vanshaj Verma on 19/04/2023
Topics: Natural gas
The United States of America (USA) became the second largest Liquified Natural Gas (LNG) exporter (10.6 Bcf/d) in the world in 2022 just shy of Australia’s exports of 10.7 Bcf/d[1]; a feat that made the headlines last year. Why? Because, only a decade before, the USA used to be a sizeable importer of natural gas. This paradigm shift became evident in 2022 when the USA imported the least amount of natural gas in the past 15 years. In this blog, we discuss the developments that led to this fundamental change in the USA’s natural gas exports and imports situation over the past couple of decades.
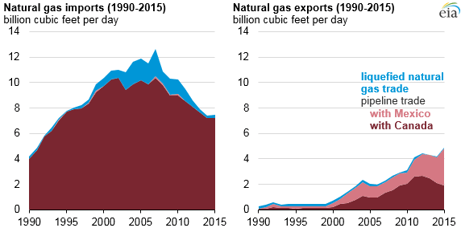
The USA has had been importing natural gas (through pipelines) from its neighbor that shares its northern border – Canada. While these imports from Canada have historically been higher during the winter months of October through March, the amount of natural gas imported by the USA averaged out to be 0.08 billion Cubic Feet/Day (Bcf/d)[2] during January to June 2022 from about 3.3 Bcf/d back in 2007[3] – a 97% reduction. While this illustrates the USA´s decision to import less natural gas, its impact on Canada isn’t very noticeable – as most of the natural gas produced in Canada is used domestically.
 |
The primary reason for the reduction in the USA’s natural gas imports has been the immense increase in its domestic natural gas production post-2005. Indeed, natural gas production has more than doubled in the past 17 years with 2022’s average being a whopping 119 Bcf/d[4] from 50 Bcf/d in 2005[5] – in fact, this period is referred to as the ´US Shale Revolution´[6]. Most of this increased natural gas production is owed to natural gas production from the Appalachian, Haynesville, and Permian regions, which account for 60% of domestic natural gas production in the USA currently[4]. Such a boom has never been seen before – not even during natural gas´ early heydays in the early 20th century. This, predictably, also led to a major shift in the USA’s LNG infrastructure development policy[5] as it changed its initial plans of building and expanding its natural gas ‘import’ facilities to launching many ‘export’ facilities in recent years.
 |
 |
|
|
|
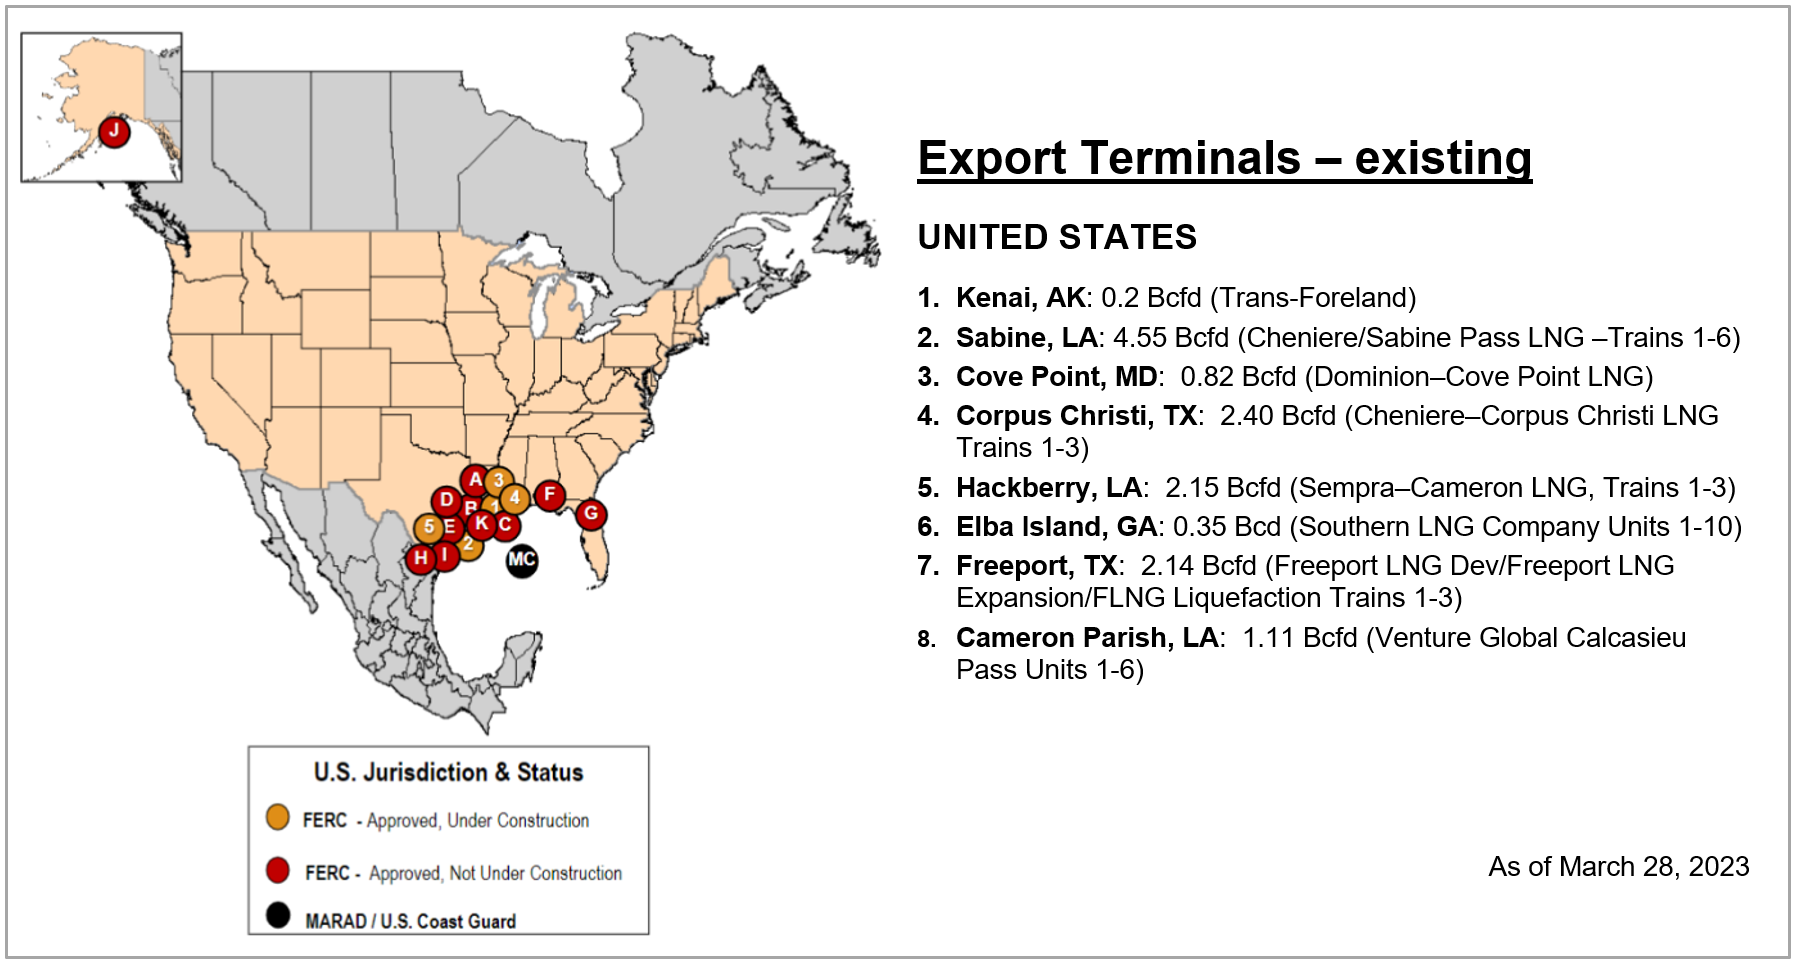
As can be seen in the charts above-right, the time between 2010–2015 was that transition period during which the natural gas imports of the USA started to decline, and it gradually pivoted itself to export more natural gas abroad. This was also the time when the first LNG export terminal in the USA – Sabine Pass in the state of Louisiana was gearing up for its debut. LNG exports from Sabine Pass, LA, started in February 2016[7], and it is now the largest LNG export facility in the world[8]. In 2019, the USA became the third largest LNG exporter globally, just behind Australia and Qatar, with ambitious plans to surpass them to become the biggest LNG exporter by the end of 2021.
2020 was a year of reduced LNG exports from the USA because of the global reduction in natural gas demand due to the COVID-19 pandemic. Then came 2021; the year in which US LNG exports doubled from 2020, averaging 9.7 Bcf/d[9]. This was mainly driven by increased liquefication capacity in the USA itself plus growing international demand for natural gas (mainly backed by China and the EU). According to the EIA, the USA’s nominal LNG capacity reached 9.5 Bcf/d in 2021, while the peak was 11.6 Bcf/d[10].
For 2022, these capacities were at 11.4 Bcf/d and 13.9 Bcf/d, respectively. The USA’s LNG exports in the month of March 2022 reached 11.7 Bcf/d[11]. This was followed by another twist in the tale with the USA’s third largest LNG export facility – Freeport in Texas – shutting down in June 2022 due to a fire incident. With this incident, US LNG exports for the rest of year averaged 10 Bcf/d[11]. Had it not been for this, the USA would have continued to be the largest LNG exporter for the entire year, instead of being number one for just the first half of 2022[12].
While US LNG infrastructure has seen decent organic growth up until 2021, 2022 has been the year wherein US natural gas really rose to the occasion despite missing the Freeport facility. With the onset of the Russia-Ukraine conflict, and Russian supplies of natural gas to the EU zone getting impacted, the USA exported 6.8 Bcf/d LNG to Europe (EU-27) and the United Kingdom last year, to address security of supply concerns. That was a staggering 141% increase with respect to the USA’s LNG exports to the same destination in 2021[13].
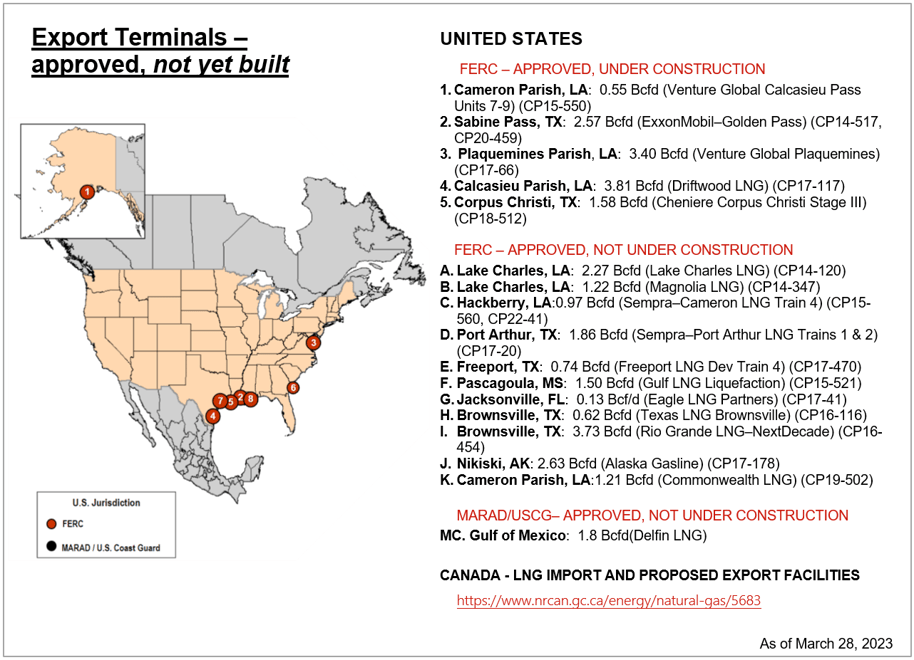
Many LNG export terminals are slated to operationalize in the coming years in the USA with the expected LNG export nominal capacity to reach approximately 14.0 Bcf/d[11] and the peak capacity to reach approximately 16.3 Bcf/d[10] by 2024.
Canada is also building its first LNG export terminal in the province of British Columbia[14] with operations expected to start in 2025. Although Canada has a decent domestic gas supply, this is the first time it´s exploring plans to export its gas. Canada plans to develop about 13 LNG export terminals on its West Coast and 5 LNG export terminals on its East Coast in the coming years, with a total capacity of 29 Bcf/d[14]. Most of this gas will come from the Western Canada Sedimentary Basin (WCSB) in British Columbia, Alberta, and Saskatchewan. With Canada on track, North America is set to become one of the prominent LNG sources for the world. It will be interesting to keep track of international LNG flows in these coming months and years and see which destinations amongst Europe, Asia-Pacific, and Latin America receive the maximum LNG from North America.
While the USA’s volumetric capabilities of building the natural gas export infrastructure cannot be undermined, it is equally important to focus on the international natural gas prices over the past 12 to 18-odd months that have led to this surge in natural gas exports from the USA, internationally.
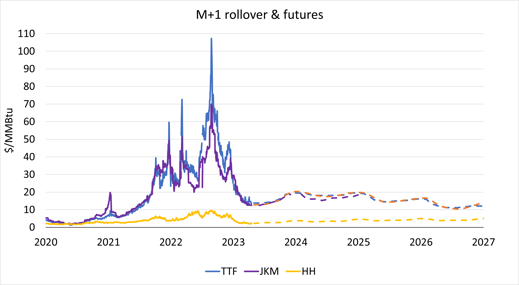
With natural gas prices reaching above 43.09 USD/MMBtu[15](average M+1 price at the TTF[16] with the highest being 107.29 USD/MMBtu) in the Eurozone in 2022, which was far greater than the natural gas prices seen in Asia-Pacific (33.96 USD/MMBtu average M+1 price at JKM[17], with the highest being 69.96 USD/MMBtu), it was crystal clear that much of the USA’s natural gas exports were directed to the Eurozone mainly because of economic reasons (for producers of gas in the USA) and security of supply concerns in Europe, with the flow of Russian gas being both sanctioned and curtailed.
 |
|
Source: E&C 2023
|
The situation currently offers an interesting scenario as well with natural gas prices (2023 to-date average M+1 price at the Henry Hub = 2.68 USD/MMBtu; TTF = 17.26 USD/MMBtu; and JKM = 17.43 USD/MMBtu) softening across the globe as both North America and Europe experienced warmer temperatures between October 2022 to March 2023. With natural gas consumption having been down[18] during the past winter, international natural gas forward and spot pricing curves have depreciated in comparison to staggering prices seen last year.
As of now, both European and Asian forward natural gas prices (TTF Cal 2024 = 18.21 USD/MMBtu; and TTF Cal 2025 = 15.61 USD/MMBtu, JKM Cal 2024 = 16.92 USD/MMBtu) are hovering above the 15 USD/MMBtu range, while the Henry Hub in the USA has plummeted down to 3.45 USD/MMBtu for Cal 2024 and 4.06 USD/MMBtu for Cal 2025, which considerably reduces the price gap seen between the Henry Hub and the TTF as compared to the huge average (M+1) price gap of USD 36.53/MMBtu seen during 2022: a crucial factor in incentivizing the majority of natural gas exports to the Eurozone back then. After discussing the rise of the USA’s LNG on the world stage, it is evident that the USA had a sweet spot opportunity to take advantage of such factors last year.
The race to be the top LNG exporter in the world is getting even more interesting. While Qatar is already looking forward to increasing its LNG export capacity from 10.27 Bcf/d (77 million metric tons/year) as of today to 16.81 Bcf/d (126 million metric tons/year) in 2027 through its North Field East and North Field South projects[19], Australia meanwhile plans to bring a couple more LNG export facilities (Barossa Gas Project[20] and Pluto Train 2[21]) online by 2025–26 in its effort to remain a top LNG supplier to China, Japan, and Korea, as in the past couple of years, amid looming concerns of having already touched its LNG peak capacity[22].
With the global natural gas markets being surrounded by a plethora of factors ranging from supply, demand, geopolitical developments, role of the USA, Canada and other natural gas exporting countries in the LNG sector, and weather-related events over recent years, it will be intriguing to track these happenings, and their plausible impact on managing the risk on global natural gas pricing in the coming months and years.
[1] Disavino, Scott. Reuters (January 4, 2023), U.S. poised to regain crown as world's top LNG exporter. Available at: https://www.reuters.com/business/energy/us-poised-regain-crown-worlds-top-lng-exporter-2023-01-04/ (Accessed: April 18, 2023)
[2] For reference 1 Bcf of natural gas is equivalent to ~ 293,071.07 MWh.
[3] Fleury, Katy. U.S. Energy Information Administration, Today in Energy (September 27, 2022), U.S. LNG imports reached 15-year lows first-half 2022, displaced by natural gas production. Available at: https://www.eia.gov/todayinenergy/detail.php?id=54019 (Accessed: April 4th, 2023)
[4] Ameen, Naser. U.S. Energy Information Administration, Today in Energy (March 29, 2023), U.S. natural gas production grew by 4% in 2022. Available at: https://www.eia.gov/todayinenergy/detail.php?id=56000 (Accessed: April 4th, 2023)
[5] Tran, Tu. U.S. Energy Information Administration, Today in Energy (April 29, 2016), Natural gas net imports in 2015 at lowest level since 1986. Available at: https://www.eia.gov/todayinenergy/detail.php?id=26032 (Accessed: April 4th, 2023)
[6] Crooks, Ed. Financial Times (April 24, 2015), The US shale revolution, Available at: https://www.ft.com/content/2ded7416-e930-11e4-a71a-00144feab7de (Accessed: April 5th, 2023)
[7] U.S. Energy Information Administration, (February 24, 2016), Natural gas weekly update. Available at: https://www.eia.gov/naturalgas/weekly/archivenew_ngwu/2016/02_25/ (Accessed: April 4th, 2023)
[8] Aizarani, Jessica. Statista (January 31, 2023), Largest operational LNG terminals in the U.S. by capacity 2021. Available at: https://www.statista.com/statistics/1263943/largest-operational-lng-terminals-by-capacity-us/#:~:text=Sabine%20Pass%20is%20the%20largest,LNG%20terminal%20by%20capacity%20worldwide. (Accessed: April 4th, 2023)
[9] Zaretskaya, Victoria. U.S. Energy Information Administration, Today in Energy (March 28, 2022), U.S. exported record amounts of liquified natural gas in 2021. Available at: https://www.eia.gov/todayinenergy/detail.php?id=51818 (Accessed: April 4, 2023)
[10] Zaretskaya, Victoria. U.S. Energy Information Administration, Today in Energy (December 9, 2021), U.S. liquefied natural gas export capacity will be world’s largest by end of 2022. Available at: https://www.eia.gov/todayinenergy/detail.php?id=50598 (Accessed: April 5, 2023)
[11] Zaretskaya, Victoria. U.S. Energy Information Administration, Today in Energy (March 8, 2023), Liquefied natural gas will continue to lead growth in U.S. natural gas exports. Available at https://www.eia.gov/todayinenergy/detail.php?id=55741 (Accessed: April 5, 2023)
[12] Zaretskaya, Victoria. U.S. Energy Information Administration, Today in Energy (July 25, 2022), United States became the world´s largest LNG exporters in the first half of 2022. Available at: https://www.eia.gov/todayinenergy/detail.php?id=53159 (Accessed: April 4th, 2023)
[13] Zaretskaya, Victoria. U.S. Energy Information Administration, Today in Energy (March 22, 2023), Europe was the main destination for U.S. LNG exports in 2022. Available at: https://www.eia.gov/todayinenergy/detail.php?id=55920 (Accessed: April 5, 2023)
[14] Natural Resources Canada (June 8, 2020), Canadian LNG Projects. Available at: https://natural-resources.canada.ca/energy/energy-sources-distribution/natural-gas/canadian-lng-projects/5683 (Accessed April 5, 2023)
[15] Here 1 Mcf = 1.037 MMBtu = ~ 1 MMBtu = 0.29371 MWh.
[16] TTF – Title Transfer Facility in the Netherlands
[17] JKM – Japanese Korean Marker
[18] Abnett, Kate. Reuters (February 21, 2023), Europe slashed winter gas use amid energy crisis. Available at: https://www.reuters.com/business/energy/europe-slashed-winter-gas-use-amid-energy-crisis-2023-02-21/ (Accessed April 5, 2023)
[19] Robinson, Therese. Natural Gas Intelligence (February 16, 2023), Qatar Moves Ahead with International Growth in Race to Lead Global LNG Trade. Available at: https://www.naturalgasintel.com/qatar-moves-ahead-with-international-growth-in-race-to-lead-global-lng-trade/ (Accessed April 18, 2023)
[20] Santos, Barossa Gas Project. Available at: https://www.santos.com/barossa/ (Accessed: April 18, 2023)
[21] Woodside Energy, Scarborough and Pluto Train 2. Available at: https://www.woodside.com/what-we-do/growth-projects/scarborough (Accessed: April 18, 2023)
[22] Lewis, Josh. Upstream Energy explored (January 19, 2022), Australia remains world's top LNG exporter but it could lose its crown this year. Available at: https://www.upstreamonline.com/lng/australia-remains-worlds-top-lng-exporter-but-it-could-lose-its-crown-this-year/2-1-1147625 (Accessed: April 18, 2023)