By Benedict De Meulemeester on 29/08/2016
Written by Benedict De Meulemeester
In March / April of this year, energy prices across the globe hit historical lows. The Brent oil price dropped to 27,88 dollar per barrel, WTI to 26,21. The price of coal for the world markets dropped to 36,55 dollar per ton. Natural gas in the US (Henry Hub 12-month forward strip) traded down to 2,11 dollar per MMBTU, European gas for next year (TTF) dropped to 13,02 euro per MWh. With fuel prices that low, it’s not surprising that power prices hit historical lows as well. The German baseload electricity price for next year dropped to 20,85 euro per MWh. Pricing in the US is very scattered, but the price for Northern Illinois as an example, traded as low as 25,30 dollar per MWh. Since then, prices have rebounded, but they remain at very low levels. Oil is currently trading just below 50 dollar per barrel, less than 11,8 % of the prices seen in the last ten years were better than that.
For buyers of energy this opens up important questions of course. Should you take this historical chance and make long-term fixings? Or are the supply and demand fundamentals supporting this bearishness so strong that we are heading for a decade of low energy prices, so it’s better to stay in the spot market? Some insight into what has been driving prices in the past decade, will teach us that giving a definitive answer to this question is impossible. Hence, the best bet is to prepare for both scenarios.
What on earth happened to peak oil? In the period 2000 – 2008, prices of energy and other commodities increased steadily to reach peaks in the first six months of 2008. An old theory that was popular in the 1970’s was revived. It assumes that production of energy resources follows the path of a bell-shaped curve whereas demand just continues to increase. Once the right-hand side of the bell-shaped curve has been reached, there is an inevitable supply crunch (peak oil). The maker of this theory, M. King Hubbert, was relatively successful in predicting the moment of the crunch in US oil supplies, giving him some credibility. An increasing number of energy market analysts interpreted the energy price bullishness as proof that peaks were occurring (Peak oil! Peak gas! Peak coal!). 8 years later, with prices at these historical lows, the declarations of the peak theorists seem ridiculous. A quick visit to the website of their association http://peak-oil.org/ will make most of us smile, or worse, get annoyed at the lack of empirical backing of what is said, e.g. that the production of oil has been almost flat since 2005, whereas in reality we’ve seen an increase of almost 12%.
Nevertheless, way back in 2008, the peak oil idea had a huge following. Goldman Sachs forecasted an increase of the oil price to 200 dollar per barrel. Many energy buyers fixed prices at the high levels of the first six months of 2008 as they believed the scary stories of ever increasing energy prices. I remember a meeting with the CEO of a big company that said: “we all agree that energy prices can only increase, don’t we”. Why were business people so easily scared into thinking that energy prices could know only one direction: up? First of all, I think that most of us have a hard time not to think in trends. It takes a lot of guts to believe in a decline when for months and months, even years and years, prices have continuously increased. Secondly, when it comes to energy pricing, many of us tend to be pessimist, energy is always too expensive, never cheap. Thirdly, the idea of scarcity was nurtured by environmentalists. When you can’t motivate people to reduce energy consumption for the sake of the environment only, fear of higher prices might be quite helpful. Eight years down the road, and on the other side of the price ranges, it might be tempting to think the other way around, to believe that the decline can only continue. Thinking back about 2008 can be a powerful reminder always to expect the unexpected, to run an energy buying strategy that is ready for the changes in the trends.
If we look at the long term developments in energy markets, we see a pattern of continuously low prices, temporarily interrupted by sharp upticks. This is caused by the way elasticity, the adaptation of supply and demand to price evolutions, works in energy markets. On both sides there is elasticity, but it works slowly, with significant delays. And the delays tend to be longer on the supply than on the demand side.
On the demand side, short term reactions to prices can occur in the shape of fuel switches, e.g. an industrial using fuel oil instead of gas for producing steam. Mid-term, consumers can lower their consumption when prices increase with behavioral efficiency gains, e.g. driving less kilometers with the car or decrease the temperature in one’s house. On the other hand, if prices are low, consumers will become more profligate. Long-term changes in energy demand due to periods of high or low prices can be caused by investments in structural energy efficiency improvements and by the effects of high or low energy prices on the economy. It would be far-fetched to say that the economic crisis that started in 2008 was caused by high energy prices, but it is clear that there was a link. Another example of this can be found in the 1980’s when the high prices of the 1970’s resulted in a sharp economic crisis resulting in much lower energy demand and two decades of low prices.
On the supply side, short term reactions occur in the shape of marginal cost decisions not to produce when prices have dropped below production costs. These reactions cause a continuous rebalancing but no structural price movements, as the capacities come back online as soon as prices increase above the production costs. More structural adaptations can be found on the mid-long term when installations are shut down when prices are too low. However, due to the high stranded costs of energy production installations, this shutdown is often rather temporary (the installation is “moth-balled”) and can be undone as soon as prices increase again. In the same fashion, we often see a supply side correction when prices are very high in the shape of bringing very old installations back online. The real structural adaptations of supply to price occur in the shape of production capacity adaptations by investments or lack of it in new production facilities. And the terms can be very long. The construction of a new power station, an LNG export terminal, ships for transporting coal, the development of an oil or gas field, etc., they can take more than a decade before the first energy is available to the market.
Having these elasticities in mind, we can perfectly understand what has happened in the energy markets in the last two decades. The strong global economic growth of the late 1990’s and early 2000’s with the exponential growth of emerging economies and China caused a voracious growth of demand for energy and other commodities. As of the mid 2000s this started to result in supply shortages causing prices to increase rapidly. Many decisions to invest in new production capacities were taken, but most of them only hit the market as of 2010. In the meantime, mid-term demand adaptations started to occur, we saw e.g. Americans choosing more fuel-efficient cars, causing a slow-down in demand growth. As of the second half of 2008, demand was slashed by the economic crisis which, as I’ve said before, was partly linked to the higher energy prices. This resulted in a sharp reduction of prices. When as of 2010 demand started to pick up again, supply extended more rapidly, resulting in a new supply glut that ended in the historically low prices of the beginning of this year. The recent bullish correction can be explained by higher demand and the mothballing of older production capacities.
It is however too early to say whether this is the definitive turnaround. It is clear that investments in new energy production capacities are slowing down, as we can see in this graph from the IEA with figures until 2013:
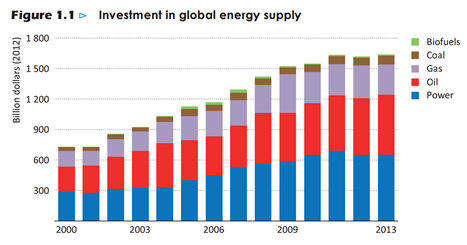
Source: Special Report: World Energy Investment Outlook, International Energy Agency, 2014, p. 20.
At some point, this slowdown in investment will result in a supply crunch such as the one that we have seen in 2005 – 2008. Whether that will be next year or whether we will see a decade of low energy prices is impossible to say. A lot will depend on how demand evolves in the meantime. Will we see another period of rapid economic growth or not? Moreover, we are seeing an increasing drive towards higher energy efficiency on a worldwide basis, meaning that more economic growth means less energy demand growth. This efficiency drive in the framework of climate policy started in Europe that has seen its primary energy demand drop by more than 10% since 2006 (although in 2015 it increased again for the first time in nine years). It is now being copied in more and more parts of the world. Will this keep down demand growth sufficiently for prices to remain low?
Slow elasticity sometimes leads some observers to the reasoning that the normal laws of economics (Adam Smith’s invisible hand) don’t work in the energy markets. They are wrong. Trends such as the sharp decrease of energy prices seen in the last five years do end at some point. Whether the recent turnaround is just temporary or the beginning of a longer period is impossible to forecast. Therefore, as an energy buyer you better prepare for all scenarios.